Churn Prediction
Check out the project on github
Churn Prediction Link to heading
Churn prediction is the process of identifying customers who are likely to stop using a company’s products or services. It is particularly important in subscription-based businesses, telecommunications, banking, and other industries where retaining customers is crucial for long-term success.
Project Overview Link to heading
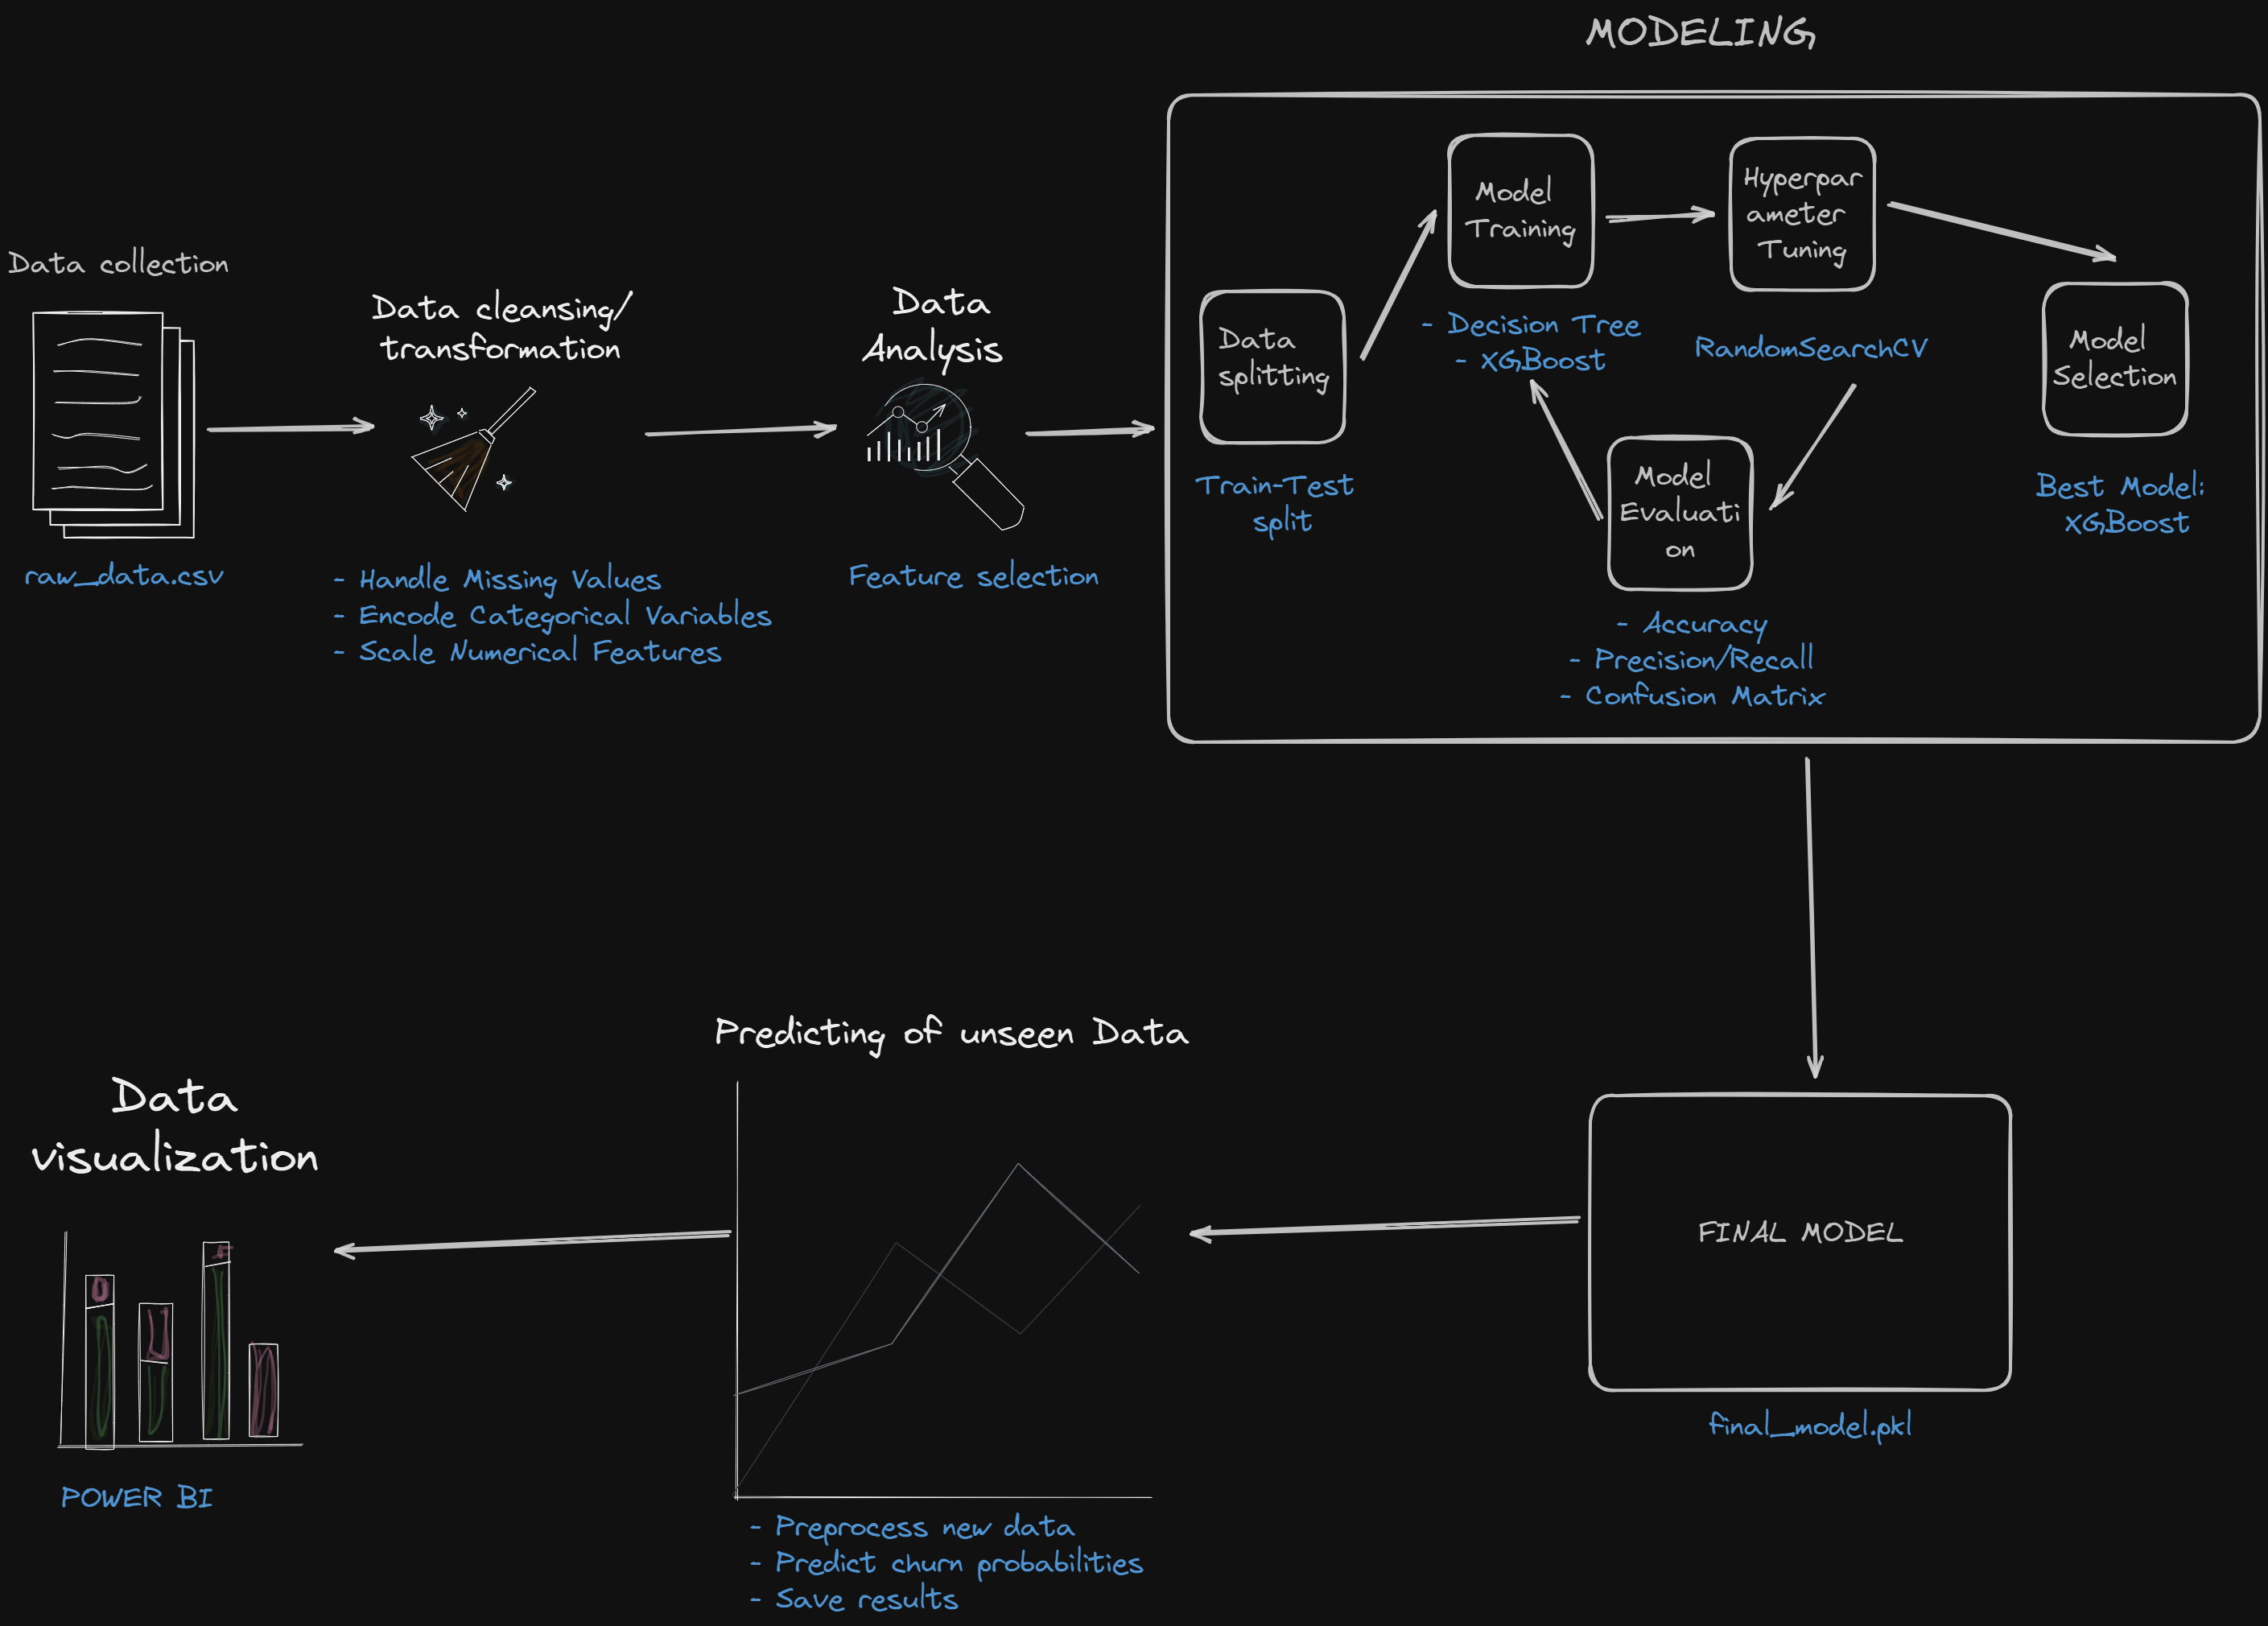
In this project, I built a machine learning model to predict customer churn using customer data. We will explore the data, preprocess it, build a predictive model, and evaluate its performance.
Project Structure Link to heading
The project has the following structure:
churn-prediction/
├── data/
│   ├── Churn_prediction_output.csv
│   ├── raw_data.csv
│   ├── unseen_data.csv
├── images/
│   ├── d_tree.png
│   ├── dtree_cm.png
│   ├── xg_cm.png
│   ├── confusion_matrix.png
├   ├── churn_BI.png
|-- model/
│   ├── final_model.pkl
├── notebooks/
│   ├── churn_prediction.ipynb
|-- vizualizations/
│   ├── churn_BI.pbix
├── README.md
|-- requirements.txt
Data overview Link to heading
The dataset contains customer information from a bank, which is used to predict whether a customer will churn (leave the bank) or not. The dataset has 10,000 total entries and 14 columns which includes the following:
- RowNumber: The row number in the dataset.
- CustomerId: A unique identifier for each customer.
- Surname: The surname of the customer.
- CreditScore: The credit score of the customer.
- Geography: The country of residence of the customer (e.g., France, Spain, Germany).
- Gender: The gender of the customer (Male, Female).
- Age: The age of the customer.
- Tenure: The number of years the customer has been with the bank.
- Balance: The account balance of the customer.
- NumOfProducts: The number of products the customer has with the bank.
- HasCrCard: Whether the customer has a credit card (1) or not (0).
- IsActiveMember: Whether the customer is an active member (1) or not (0).
- EstimatedSalary: The estimated salary of the customer.
- Exited: Whether the customer has churned (1) or not (0).
- Dataset Summary
Requirements Link to heading
- graphviz
- joblib
- numpy
- pandas
- scikit-learn
- scipy
- seaborn
- xgboost
Running the project Link to heading
To run the project, you need to have Python installed on your machine. Clone the repo. You can install the required packages by running the following command:
pip install -r requirements.txt
After installing the required packages, you can run the Jupyter notebook churn_prediction.ipynb to explore the data, preprocess it, build a predictive model, and evaluate its performance.
Data preparation Link to heading
Data preprocessing Link to heading
The data was cleaned and preprocessed by handling missing values, encoding categorical variables (Geography, Gender, HasCrCard, IsActiveMember), and scaling numerical features (CreditScore, EstimatedSalary, Balance, Age).
Feature selection Link to heading
Features were selected based on their importance and relevance to predicting churn. The following features were used: CreditScore, Geography, Gender, Age, Tenure, Balance, NumOfProducts, HasCrCard, IsActiveMember, EstimatedSalary.
Modeling Link to heading
Model Training Link to heading
Two models were trained: Decision Tree and XGBoost. These models were chosen for their ability to handle complex relationships and provide feature importance insights. The models were trained on the training data and evaluated on the testing data.
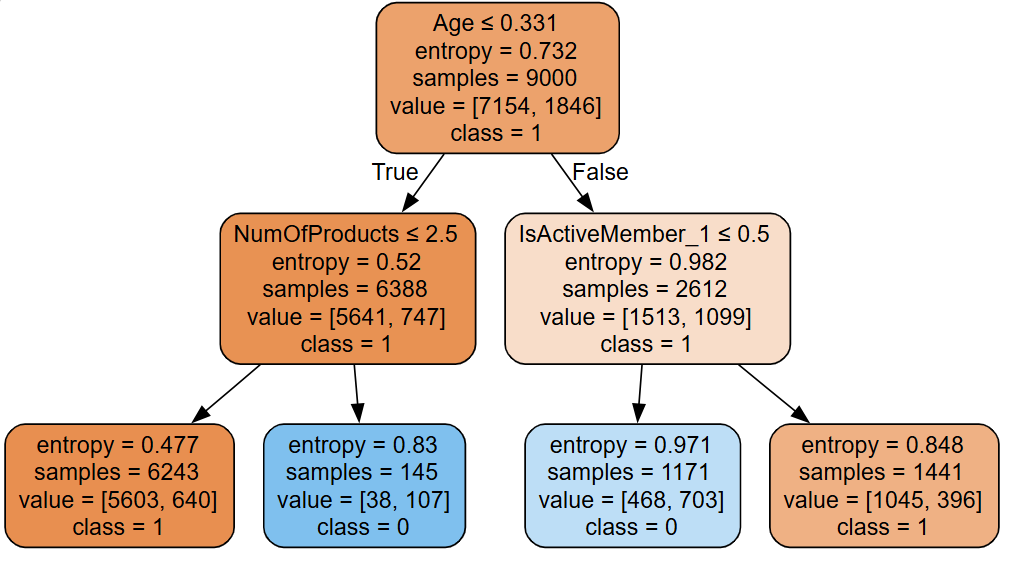
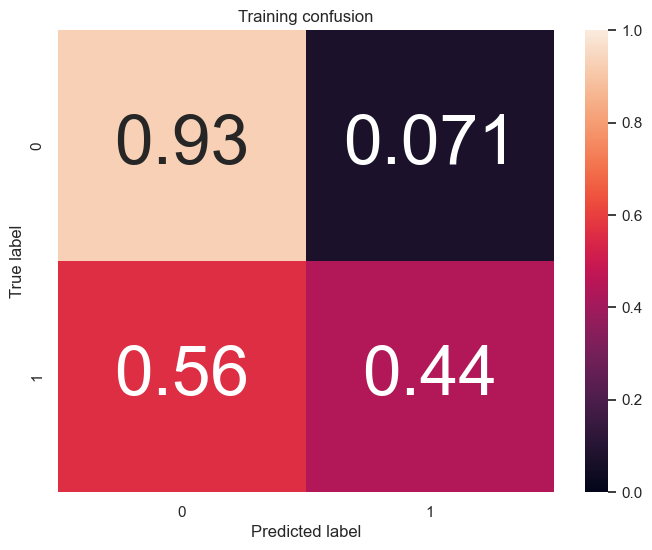
Decision tree model and confusion matrix:
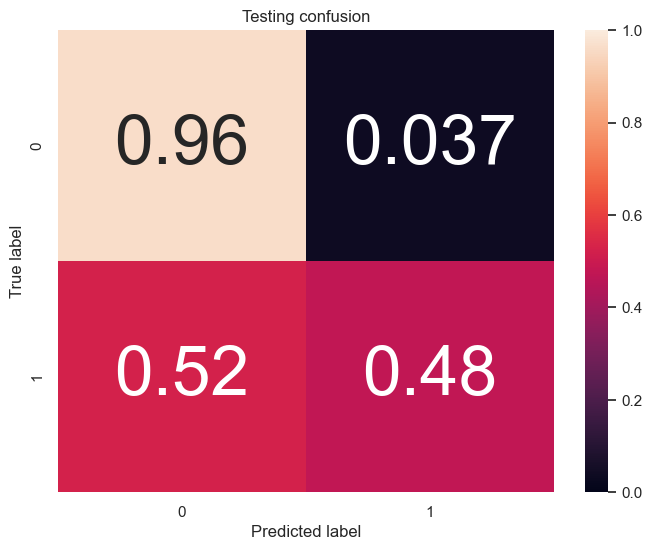
XGBoost confusion matrix:
Training and Testing Accuracy Link to heading
- Decision Tree: Training Accuracy: 82.9%, Testing Accuracy: 83.6%
- XGBoost: Training Accuracy: 100%, Testing Accuracy: 87%
The XGBoost model outperformed the Decision Tree model in terms of testing accuracy, making it the preferred model for predicting customer churn.
Hyperparameter Tuning Link to heading
Hyperparameters for the XGBoost model were tuned using RandomizedSearchCV to find the best combination of parameters for optimal performance.
{'min_child_weight': 3,
 'max_depth': 8,
 'learning_rate': 0.05,
 'gamma': 0.1,
 'colsample_bytree': 0.4}
Model Evaluation Link to heading
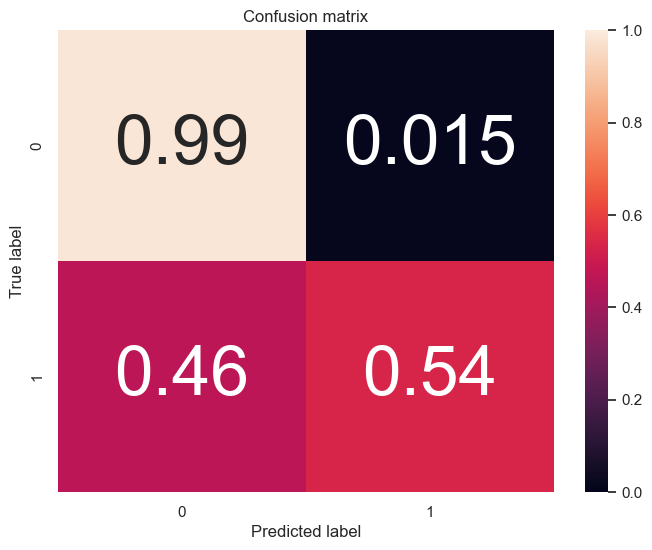
The models were evaluated using accuracy, confusion matrix, precision, recall, and other metrics to assess their performance. The confusion matrix for the BEST XGBoost model is shown below:
Predictions Link to heading
Predicting Unseen Data Link to heading
The model was used to predict unseen data. The same preprocessing steps were applied to the new data before making predictions.
Output Interpretation Link to heading
The output includes churn predictions and probabilities, saved in Churn_prediction_output.csv.
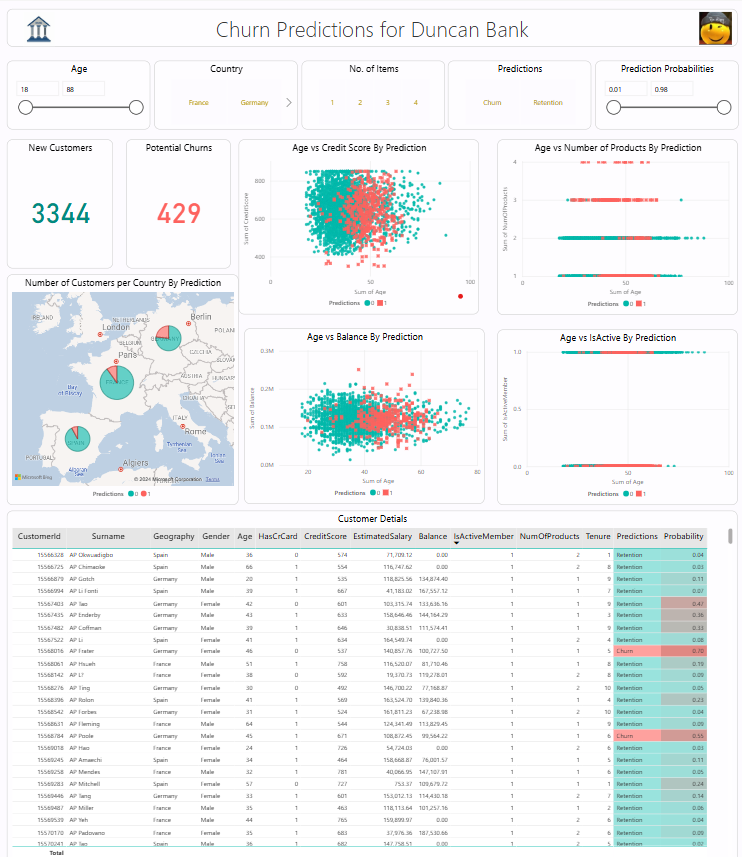
Power BI visualization Link to heading
A Power BI report was created to visualize the data and model predictions. The report includes visualizations of customer churn, feature importance, and model predictions. The report can be found in the vizualizations folder, churn_BI.pbix, and a screenshot is shown below:
License Link to heading
This project is licensed under the MIT License.
Conclusion Link to heading
Special thanks to Data 390 YP on youtube