
If you have ever made a classification model, you have probably found out the quality of your model by maybe checking the accuracy. Well that good but check this out.
Imagine you have a model that predict cats when it is trained on 1000 features containing 990 cats and 10 dogs, if we are to calculate the accuracy it will be 99%. But here the model completely misclassifies all of the apples. So sometimes we need better metrics to evaluate the overall quality and performance of our model.
WHAT IS CONFUSION MATRIX? 🤔
Confusion Matrix also known as Error Matrix is a tool used to give the Best Interpretation of a classification algorithm, it shows vividly the kind of error the model is making and on what class it made the error.
Fun Fact: It tells us where the model is getting confused 😂.
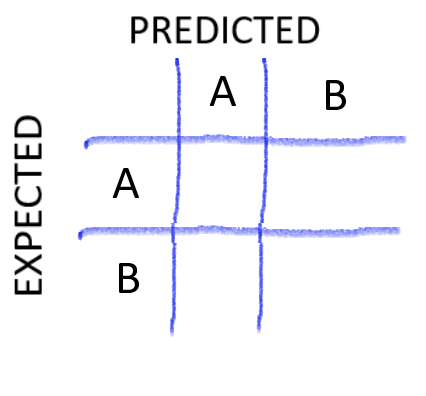
Ok so, above is a typical 2 x 2 Confusion Matrix, on the right, we have the expected classes also known as the actual classes that the model is supposed to predict, on the top we have the predicted values that the model gave us, it is more like the models results.
In reality you will be using libraries already made for getting the confusion matrix. Confusion matrix can be of any size it just depends on the number of classes (It is an N x N Matrix). But let’s go through a simple 2 x 2 confusion Matrix in order to understand how to read it and know how it works.
Imagine in a classification problem of predicting class A we have:
100 samples | Class A has 62 | Class B has 38.
Model predicts 53 correctly predicted as class A
Model predicts 19 correctly predicted as class B.
If we are to fill in the Data that was given to us in a confusion Matrix, it will look something like this 👇
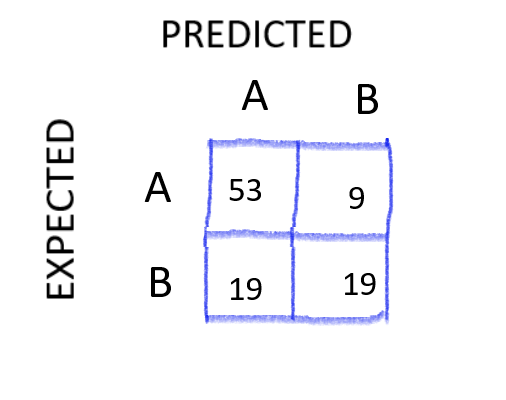
Ok so how did i fill this up.
First of all, the total Number in the Confusion Matrix (53 + 9 + 19 + 19) should give me the number of sample (100).
Starting from the first cell — How many samples were predicted correctly as class A that were expected/actually class A? — 53
Second cell — How many classes were incorrectly predicted as class B that were meant to be predicted as class A? — We already know that class A has 62 samples therefore it will be -> 62–53 = 9
Fourth cell — How many samples were predicted correctly as class that were expected/actually class B? — 19
Third cell — How many classes were incorrectly predicted as class A that were meant to be predicted as class B? — We already know that class B has 38 samples therefore it will be -> 38–19 = 19
You may want to take your time on the whole process again for better understanding 🙂.
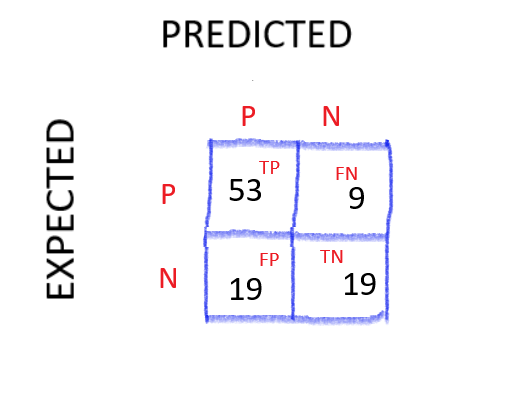
Ok, so this is a binary classification problem, we basically want a single class from the 2 classes. So, we use the term **POSITIVE **to refer to the outcomes we want to detect and **NEGATIVE **to everything else.
Going back to our Confusion Matrix ->
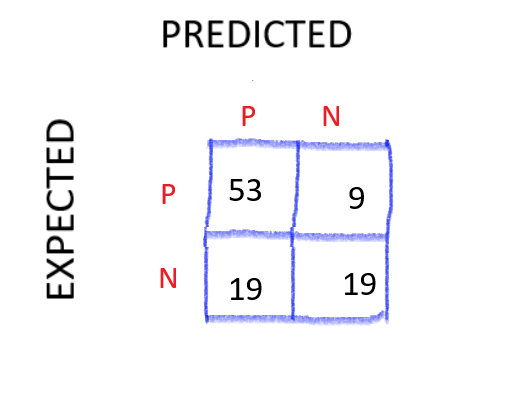
You can see what going on now,
53 samples that we** EXPECTED** to be **POSITIVE were PREDICTED POSITIVE — **making them the TRUE POSITIVE (TP)
9 samples that we EXPECTED to be POSITIVE were **PREDICTED NEGATIVE **— making them the FALSE NEGATIVE (FN)
19 samples (on the left) that we EXPECTED to be NEGATIVE were PREDICTED POSITIVE — making the FALSE POSITIVE (FP)
19 samples (on the right) that we** EXPECTED** to be** NEGATIVE** were **PREDICTED NEGATIVE **— making them the TRUE NEGATIVE (TN)
YAY!! 🤩…….. So now we have these values we can calculate the PRECISION and RECALL…. In short, Precision can be seen as QUALITY and Recall can be seen as a measure of QUANTITY.
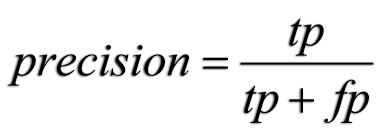

So with these formulars we can calculate the precision and recall of our model. But there is a Tradeoff between them☹️. The Idea behind the precision-recall trade-off is that when a person changes the threshold for determining if a class is positive or negative it will tilt the scales. What I mean by that is that it will cause precision to increase and recall decreasing, or vice versa.
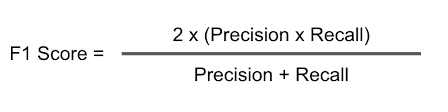
Luckily, we can combine the both of them and that is called **F1-Score. **The F1-Score is the harmonic mean of the Precision and the recall.
So far you should have all you need to be able to understand a confusion matrix. The main Job of the confusion matrix is to zoom into the model and point out the mistakes that the model is making. This gives us the best strategy we could use to improve the model.
Thats pretty much it. THANKS for making it this far…. ✌